Hay dejo varias fuentes, abajo relacionadas :-)
http://www.cacti.net/
About Cacti
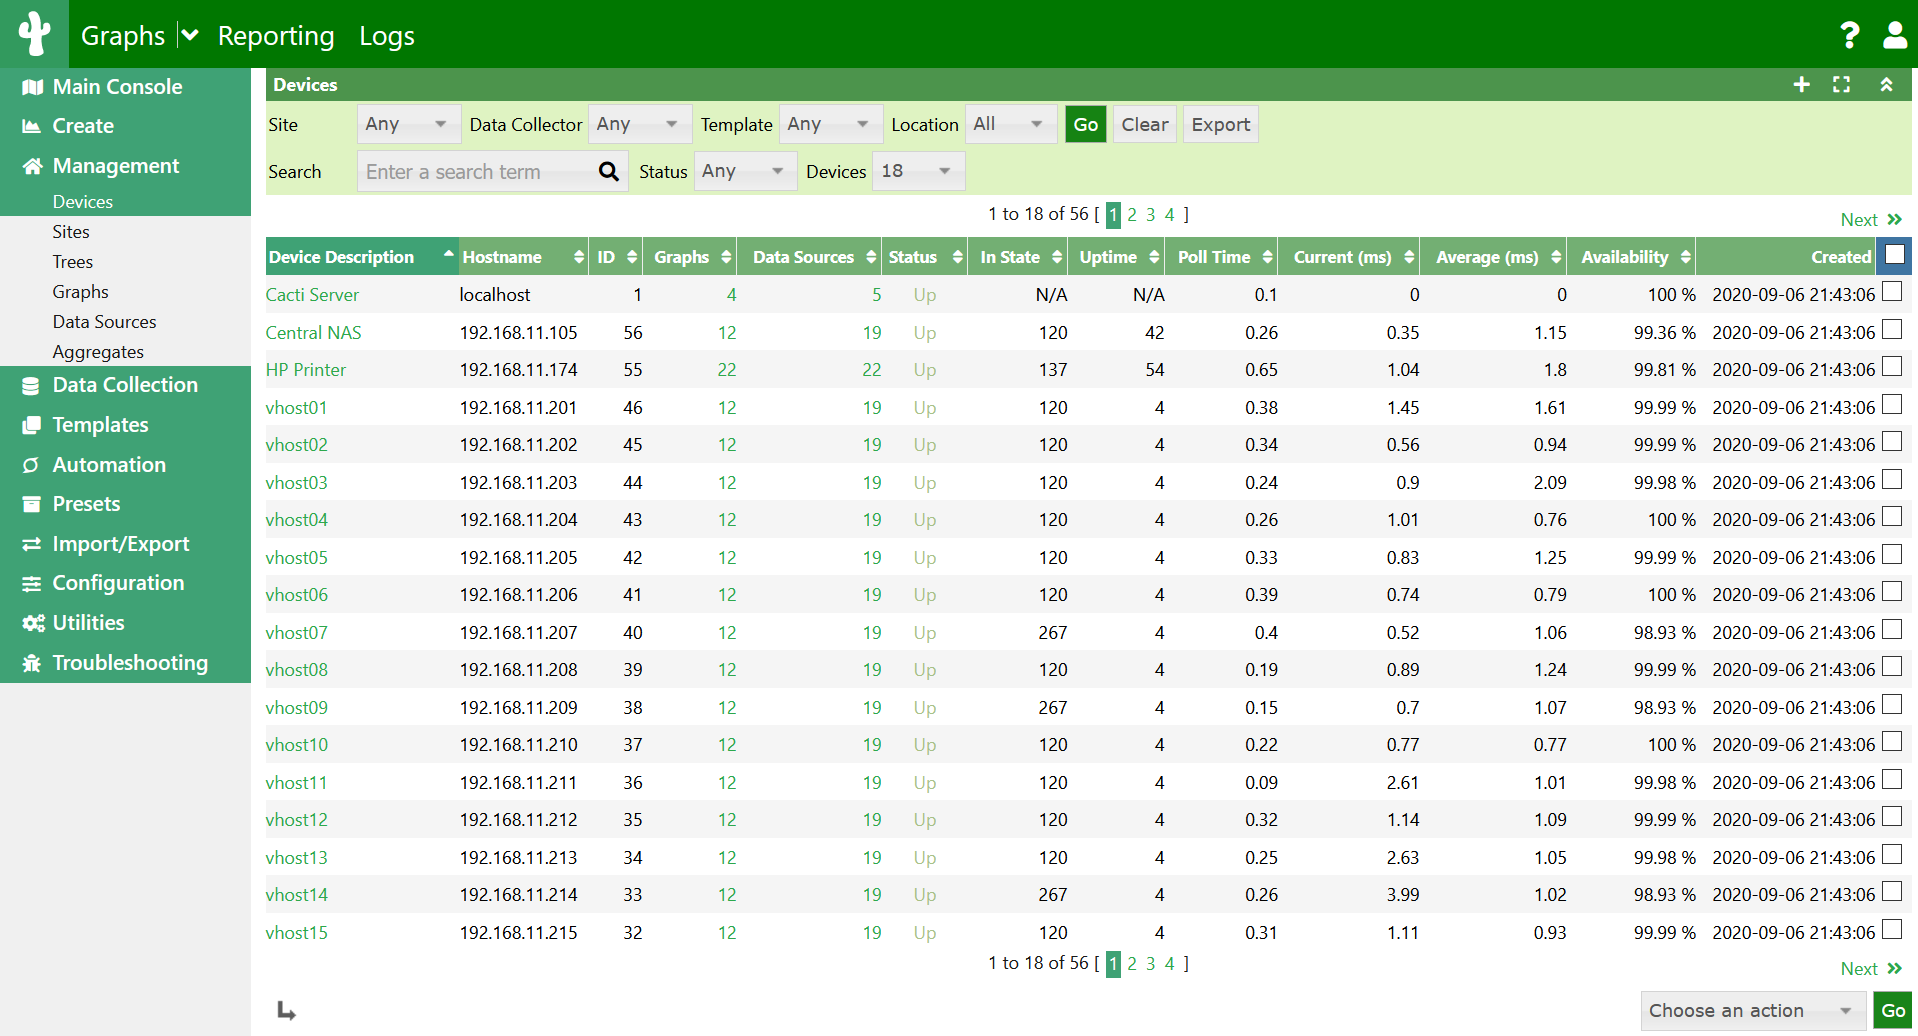
Cacti is a complete network graphing solution designed to harness the power of RRDTool's data storage and graphing functionality. Cacti provides a fast poller, advanced graph templating, multiple data acquisition methods, and user management features out of the box. All of this is wrapped in an intuitive, easy to use interface that makes sense for LAN-sized installations up to complex networks with hundreds of devices.
Icinga
Icinga is an offshoot
of Nagios that is currently being rebuilt anew. It offers a thorough
monitoring and alerting framework that’s designed to be as open and
extensible as Nagios is, but with several different Web UI options.
Icinga 1 is closely related to Nagios, while Icinga 2 is the rewrite.
Both versions are currently supported, and Nagios users can migrate to
Icinga 1 very easily.
NeDi
NeDi may not be as well
known as some of the others, but it’s a great solution for tracking
devices across a network. It continuously walks through a network
infrastructure and catalogs devices, keeping track of everything it
discovers. It can provide the current location of any device, as well as
a history.
NeDi can be used to locate stolen or lost devices by alerting you if they reappear on the network. It can even display all known and discovered connections on a map, showing how every network interconnect is laid out, down to the physical port level.
NeDi can be used to locate stolen or lost devices by alerting you if they reappear on the network. It can even display all known and discovered connections on a map, showing how every network interconnect is laid out, down to the physical port level.
Observium
Observium combines
system and network monitoring with performance trending. It uses both
static and auto discovery to identify servers and network devices,
leverages a variety of monitoring methods, and can be configured to
track just about any available metric. The Web UI is very clean, well
thought out, and easy to navigate.As shown, Observium can also display the physical location of monitored devices on a geographical map. Note too the heads-up panels showing active alarms and device counts.
Zabbix
Zabbix monitors servers
and networks with an extensive array of tools. There are Zabbix agents
for most operating systems, or you can use passive or external checks,
including SNMP to monitor hosts and network devices. You'll also find
extensive alerting and notification facilities, and a highly
customizable Web UI that can be adapted to a variety of heads-up
displays. In addition, Zabbix has specific tools that monitor Web
application stacks and virtualization hypervisors.
Zabbix can also produce logical interconnection diagrams detailing how certain monitored objects are interconnected. These maps are customizable, and maps can be created for groups of monitored devices and hosts.
Zabbix can also produce logical interconnection diagrams detailing how certain monitored objects are interconnected. These maps are customizable, and maps can be created for groups of monitored devices and hosts.
Fuentes:
1 http://www.networkworld.com/article/2880536/network-management/best-open-source-monitoring-tools.html
2 http://www.infoworld.com/article/2683857/network-monitoring/article.html#slide7
No hay comentarios:
Publicar un comentario